Fibotin geliştiren: Tapio Salo
visualize the fibonacci retracement levels
4 kullanıcı4 kullanıcı
Uzantı meta verileri
Ekran görüntüleri


Bu uzantı hakkında
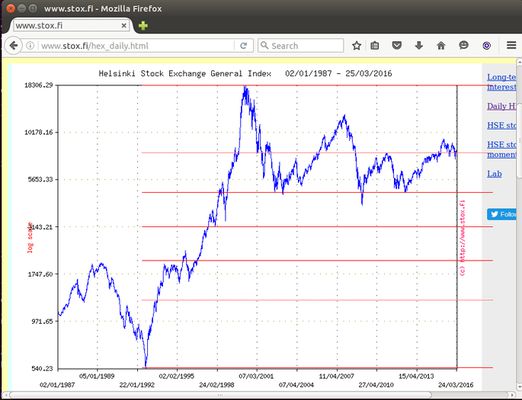
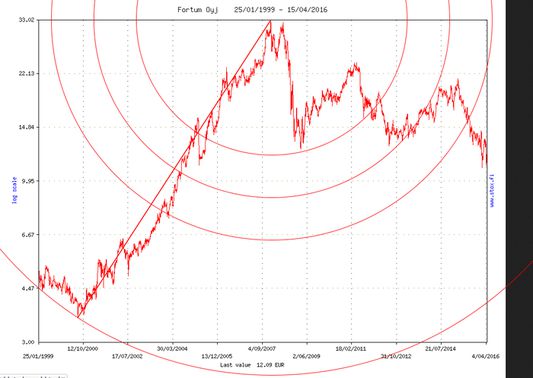
Fibotin is a plotting tool for illustrating the fibonacci retracement level graphically from the stock chart images found from pages related to stock markets. With this tool user can set fibonacci retracement levels on the image in the web page and quickly see if the the price action is close to any desired retracement levels.
For background information see articles about technical analysis for stock markets.
http://stockcharts.com/school/doku.php?id=chart_school:chart_analysis:fibonacci_retracemen
For background information see articles about technical analysis for stock markets.
http://stockcharts.com/school/doku.php?id=chart_school:chart_analysis:fibonacci_retracemen
1 inceleyiciden 2 puan aldı
Daha fazla bilgi
- Sürüm
- 3.1resigned1
- Boyut
- 16,21 KB
- Son güncelleme
- 2 yıl önce (25 Nis 2024)
- Lisans
- MIT Lisansı
- Sürüm geçmişi
- Koleksiyona ekle